Performance Dashboard
Personalized dashboards give supervisors constant access to their teams’ latest trends and performance indicators. The Dashboard view and interface language varies depending on the privileges associated with your user profile and the settings you have configured using Admin and Account Settings.
By default, the interface language of QC Portal is in English. You can change the default language of QC Evaluations Portal and the My Evaluations tab in the QC Portal to Russian, Simplified Chinese, Traditional Chinese, Korean, German, Portuguese, French and Japanese.
From the Dashboard, you can:
View all or individual agents' performance trends and dashboard configurations.
Compare the performance data of the past 7 days to the data of the previous 7 days.
See details of the selected evaluation metrics.
See normalized or observed score, rank and total number of evaluations or interactions per KPI in the Team Performance panel.
See agent specific normalized or observed score, rank and total number of evaluations or interactions in the Agent Performance panel for the selected scorecard or KPI.
See how an agent's evaluation scores measure up against the group average.
Keep track of coaching requests and follow-up actions.
View other supervisors' team data such as performance trends, evaluation scores and metrics. This is helpful in absence of a supervisor to look into the team data.
The view access for other supervisors' data is based on the logged-in supervisors' association to the hierarchy.
Navigating the Dashboard
Team Performance
The Team Performance panel displays pre-defined scorecards. The panel can display up to nine scorecards at a time. To see long scorecard titles, you can change the width of the scorecard tabs using the Tab Width button controls in the top-right of the panel.
Each scorecard displays team performance parameters with respect to pre-defined KPIs. You can select the required scorecard to list all the specified KPIs and to view the related performance parameters for each KPI. The performance parameters include normalized or observed score, rank, trend chart, and total number of evaluations or interactions. The rank is calculated based on the normalized or observed score.
Viewing Normalized Score
Normalized Score is the default displayed score for all type of scorecards. Based on the evaluation scoring method, the actual score is calculated, normalized and then displayed. See Guidelines for Scoring.
The rank is also calculated based on the normalized score and displayed in the dashboard.

Viewing Observed Score
To view the observed score, you must select the View Dashboard in Observed score checkbox in QC Portal under Admin > Settings. See Settings.
Based on the evaluation and metadata scoring methods, the actual score is calculated and then displayed. This score doesn't get normalized. You must use this score type when you want to view the actual score rather than normalized score. The observed score also helps to calculate the rank accurately. This score and rank helps to view your team's actual performance against all the specified KPIs in the selected dashboard.

When you view the observed score , the Trend and Change columns are not displayed.
Agent Performance
The Agent Performance panel displays individual agent's performance parameters for the selected KPI or the selected scorecard in the Team Performance panel. To view the agent performance panel, click  .
.
You can choose whether to include the agents' rank in the Agent Performance slide-out window. To do this, select the Allow agents to view rank in the Agent Performance grid checkbox in the QC Portal under Admin > Settings. See Settings.
In this panel, you can view observed or normalized score, rank, and the total number of evaluations or interactions per agent. This helps supervisors to identify the specific agent's performance and decide the next course of action such as coaching.
Viewing Normalized score
You can view an individual agent's normalized score, rank, and the total number of evaluations or interactions per KPI. The normalized score changes based on the type of goal and threshold range that you select while defining a scorecard. See Goals.

For Single Directional goal type, if two agent's score falls within the Good threshold range, then the normalized score and rank for both the agents will be the same.
Viewing observed Score
To view the observed score, you must select the View Dashboard in Observed score checkbox in the QC Portal under Admin > Settings. See Settings.
You can view observed score and rank in the Agent Performance panel only when you select a KPI in the Team Performance panel.
You can view an individual agent's observed score, rank, and the total number of evaluations or interactions per KPI. The observed score changes based on the type of goal and threshold range you select while defining a scorecard. See Goals.
For Single Directional goal type, if two agent's score falls within the Good threshold range then the rank for both the agents will be different. This helps you to identify actual performance and rank for agents.

For Bi-Directional goal type, for the scores that fall in the lower Out of Bounds threshold range, the rank is assigned in an ascending negative order. For example, if the score is 70, 80, 90, the rank will be assigned as -3, -2, -1 respectively. For the scores that fall in the Good threshold range, the rank is assigned in an ascending positive order. For example, if the score is 103, 108, 110, the rank will be assigned as 1, 2, 3 respectively. For the scores that fall in the higher Out of Bounds threshold range, the rank is assigned in an ascending positive order. For example, if the score is 150, 160, 170, the rank will be assigned as 4, 5, 6 respectively.

The assigned rank is either positive or negative, it will never be zero.
The following table explains the few possible example scenarios.
|
Goal type and threshold range |
Score |
Rank |
|---|---|---|
| Single Direction with Caution | ||
| Good 0-70 | 55 | 1 |
| Caution 70-100 | 83 | 2 |
| Out of Bound 100 - | 115 | 3 |
| Bi-Direction with Caution | ||
| Out of Bound 0-70 | 65 | -2 |
| Caution 70-100 | 98 | -1 |
| Good 100-110 | 110 | 1 |
| Caution 110-150 | 140 | 2 |
| Out of Bound 150 - | 170 | 3 |
Evaluation Performance
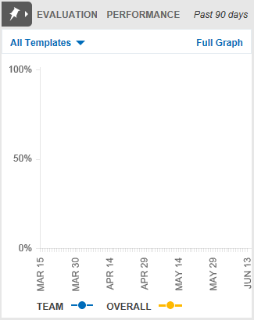
Administrator and Supervisor profiles can choose to include or exclude the Evaluation Performance area in Administration > Settings > Dashboard Data - it will appear in the upper-right corner of the dashboard. Here, you can view the team's overall evaluation score performance for the selected template within the past three months. You can toggle between the watch list view and the evaluations performance view by clicking the pushpin.
The watch list is used to monitor specific agents' performance or a particular quality initiative for the entire team. You can click the pushpin next to metrics to add or remove them from your watch list.
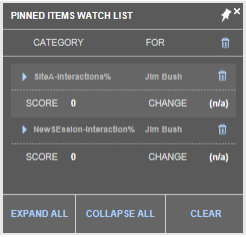
The watch list displays only the normalized score related data and doesn't support observed score related data.
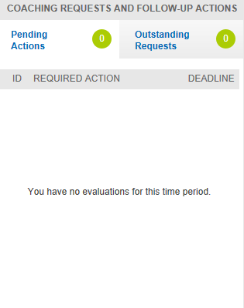
Coaching
The pending coaching actions can be seen from 12/10/2019 onwards.
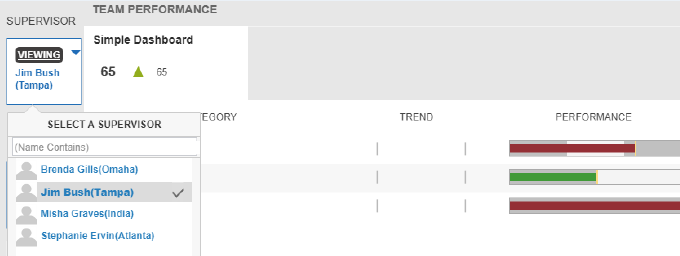
Viewing other team data using hierarchy
To view other supervisors' team data using the hierarchy association:
1. Click VIEWINGin the upper-left corner of the dashboard.
2. Select the supervisor for which you want to view the team data.